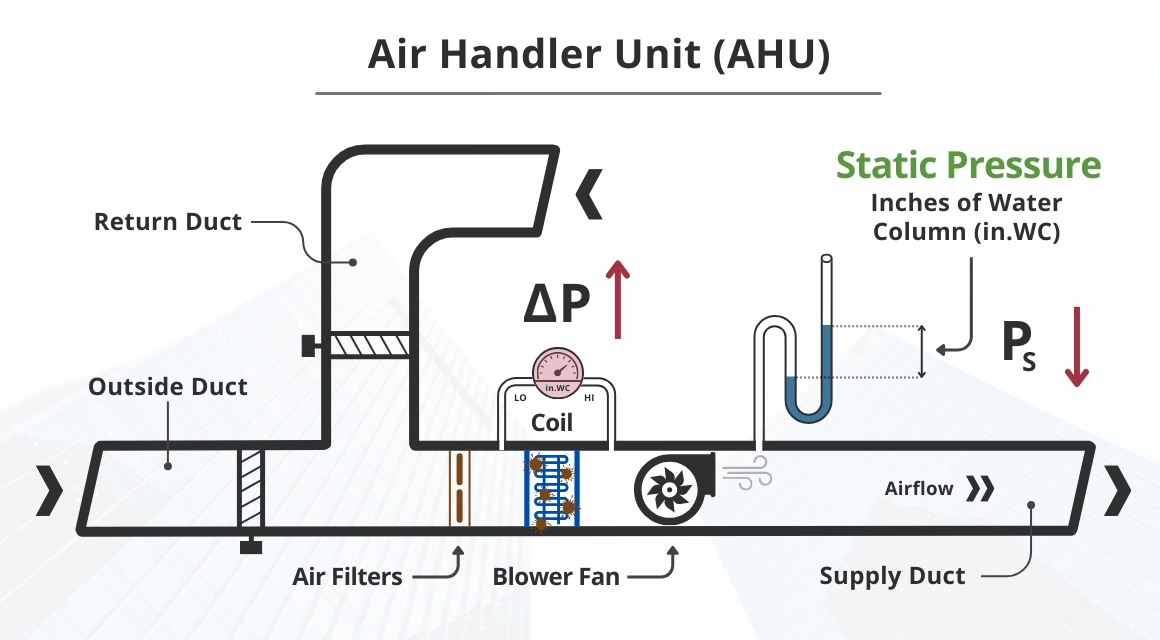
A fan curve is a graphical representation displaying the relationship among static pressure, brake horsepower, and airflow volume for a particular fan type. Fan curves help in understanding the fan’s performance under different circumstances or points of operation, aiding in the fan selection process for specific applications.
Fan performance curve data is typically generated by connecting the fan to a laboratory test chamber, following specific methods and procedures, such as those described in ANSI/AMCA Standard 210. This standard establishes uniform test methods for a laboratory test of a fan or other air-moving device to determine its aerodynamic performance in terms of airflow rate, pressure developed, power consumption, as well as other factors such as air density, speed of rotation, and efficiency.
Static Pressure Curve
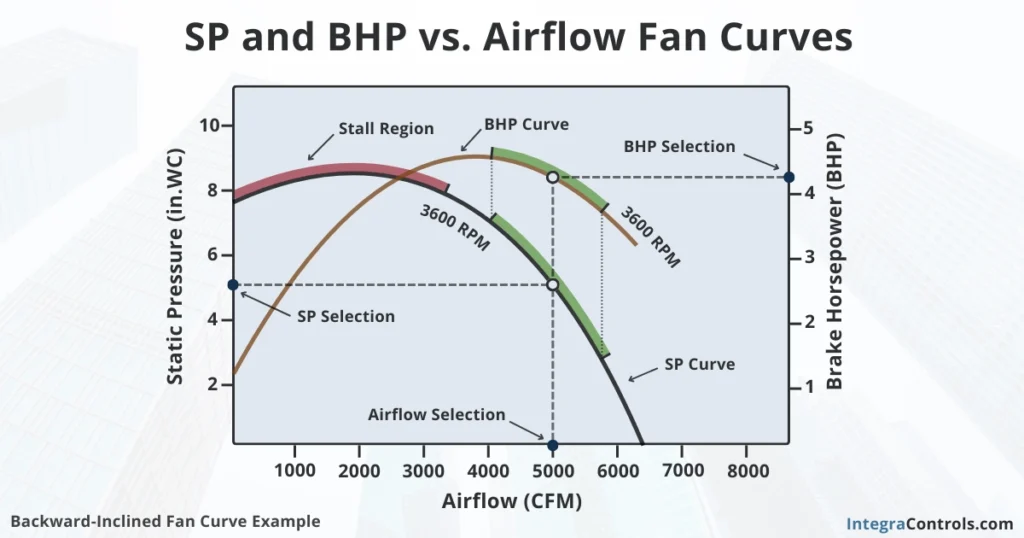
The static pressure curve is a fan curve that shows the relationship between static pressure (SP) and airflow volume (CFM) for a specific fan RPM (revolutions per minute). In other words, this curve represents how much air volume, measured in cubic feet per minute (CFM), the fan can move for different levels of airflow resistance or static pressure, measured in inches of water column (in WC).
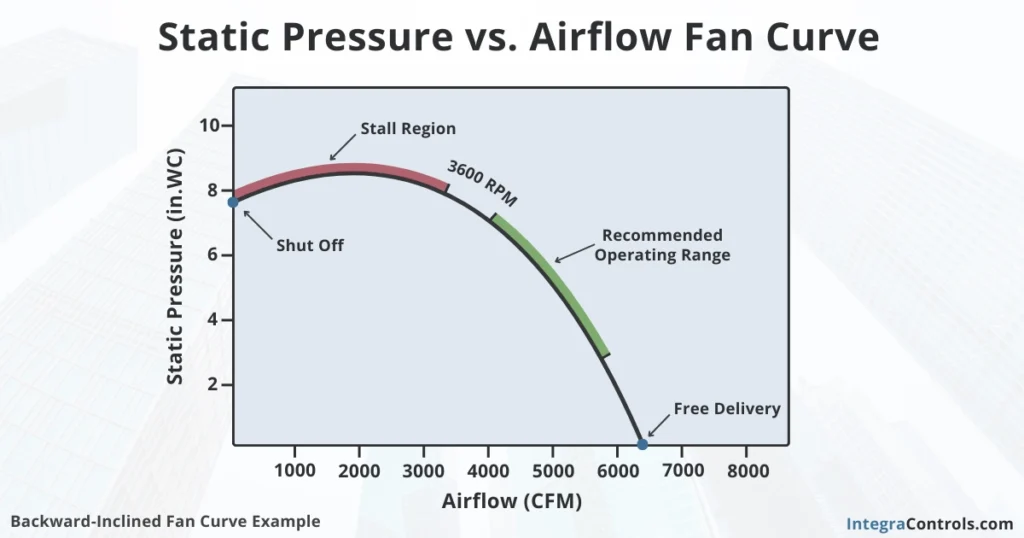
As shown in the static pressure vs. airflow curve, when static pressure is zero (no airflow resistance), the fan delivers maximum airflow. This point is referred to as “free delivery,” “free air,” or “wide open performance.” On the other hand, at the maximum static pressure value, the airflow is zero. The fan is rotating and generating static pressure but not moving air. This is referred to as the “shut off,” “no flow,” or “static no delivery” point.
The recommended fan operation region for selecting a fan is where the static pressure vs. airflow curve displays an approximately linear and inverse relationship (negative slope). However, the exact point of operation for selecting a fan will require considering other factors such as the system and efficiency curves, which we will cover later in this article.
Additionally, the fan curve shows a “stall region,” normally located at low air volume and high static pressure levels of the curve. In this region, the fan is not stable, causing vibration, excessive noise, and surge that can damage the equipment. The stall region should be avoided. Some manufacturers sometimes choose not to show this region in the fan curves to prevent the fan operation point from being incorrectly placed in that region.
Fan Type-Based Performance Characteristics
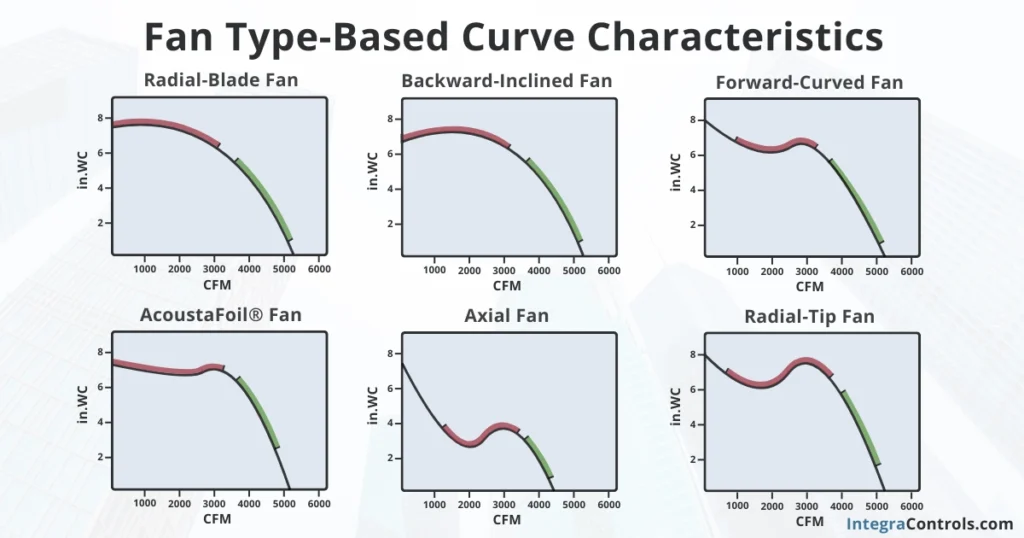
The fan curve performance characteristics (shape of the curve) will change depending on the flow characteristics, which correlate with the different types of fan wheels and blades (i.e., radial, backward-inclined, radial-tip, axial, Acoustafoil®, and forward-curved). In addition, the curve characteristics will also vary from one manufacturer to another, depending on the final fan design.
Brake Horsepower Curve
The brake horsepower curve is a fan curve that shows the relationship between brake horsepower (BHP) and airflow volume (CFM) for a specific fan RPM (revolutions per minute). In other words, this curve represents how much brake horsepower is required to move a certain amount of air volume measured in cubic feet per minute (CFM).
Fan wheels are normally mechanically connected to some sort of rotating machine, such as electric motors. One of the most important ratings when selecting a motor is the horsepower rating. With the help of the brake horsepower fan curve, we can properly choose the motor size required for the application.
Brake horsepower is similar to the normal horsepower rating, with the difference that BHP accounts for frictional losses, providing a more accurate measure of power requirements. One horsepower (HP) is equivalent to just under 0.99 BHP.
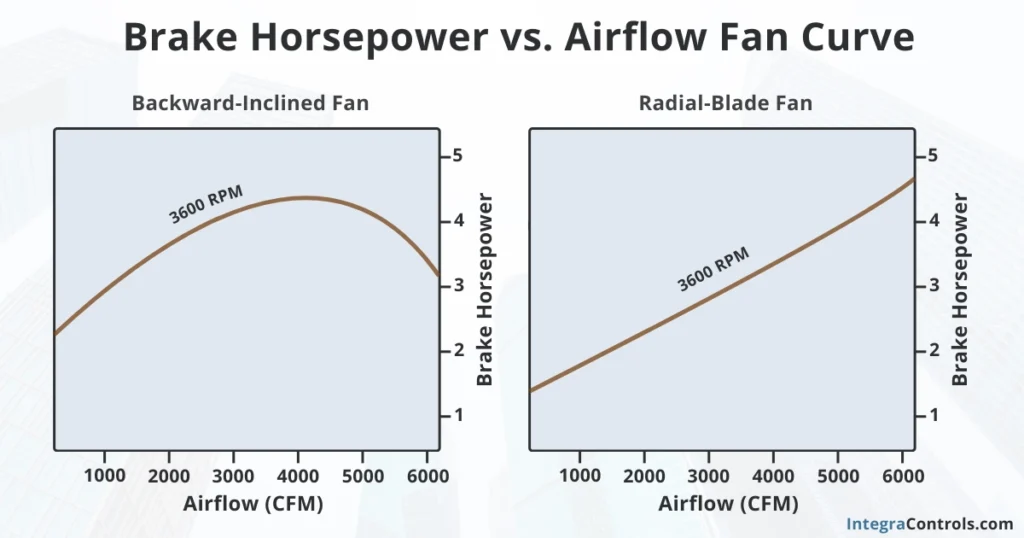
The brake horsepower fan curve characteristics depend on the fan type. For example, a radial-blade fan displays a close-to-linear and direct correlation with airflow: as the air volume increases, so does the brake horsepower. On the other hand, a backward-inclined fan horsepower performance curve shows different behavior: as the fan’s volume increases, the BHP curve reaches a peak and then drops off, displaying lower horsepower requirements at higher airflow volumes.
By combining the static pressure and brake horsepower fan curves, we can visualize the proper horsepower curve segment useful for selecting a motor, typically located on the right portion of the curve, avoiding the “stall region” of the static pressure curve. We can estimate the brake horsepower requirements of the mechanical equipment by drawing a line from the desired CFM value up until we cross over the BHP curve.
System Curve
As mentioned before, when a fan is running with no airflow resistance (zero static pressure), it delivers its maximum airflow capacity. This is the case for a fan that has not been connected to a system and, therefore, operates at the “free delivery” point.
However, typically, fans are part of an air distribution system, which is composed of ductwork, filters, dampers, coils, energy recovery wheels, terminal units, etc. This system imposes resistance to airflow in the form of static pressure. Therefore, the fan selected for the application must overcome the total system static pressure (airflow resistance) to move air through it.
The system curve is a parabolic curve with a positive slope displaying the static pressure (SP) or airflow resistance that the system exerts at different airflow values (CFM). The system curve is obtained with the help of modeling software that considers all the components of the air distribution system.
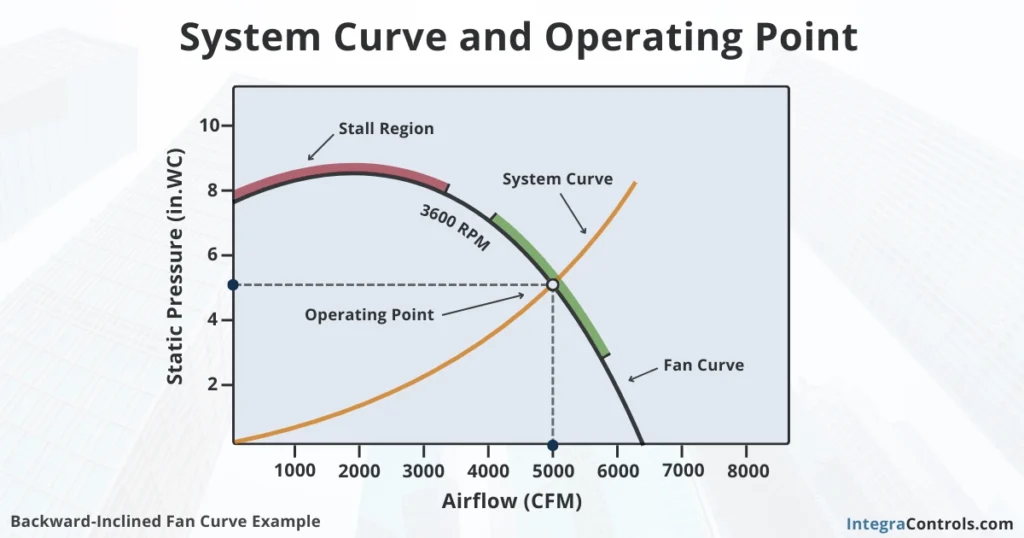
The point where the static pressure fan curve and the system curve intersect is the operating point. This is where both the fan and the system reach stable equilibrium. In other words, the fan overcomes a static pressure level that enables air movement through the system.
System characteristics play a significant role in estimating fan capacity. Changes in the system, such as adding or removing ductwork or terminal units or upgrading filters’ MERV ratings, can move the system curve to points that change the fan’s performance. For instance, upgrading air filters for higher MERV filtration ratings can cause the system curve to shift to the left, very similar to having dirty filters, decreasing the total airflow output capacity and affecting the performance of the entire system.
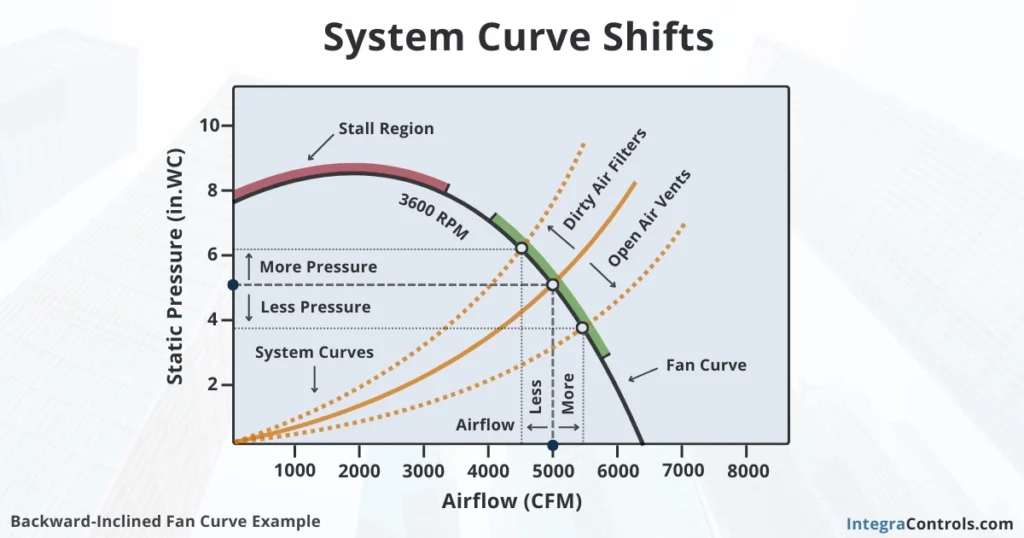
Therefore, it is very important to communicate to the system design consultants that future modifications to the system may occur. This way, they can properly size the equipment and be conservative when choosing an operating point, allowing more flexibility for future system modifications.
Variable System Curve Characteristic
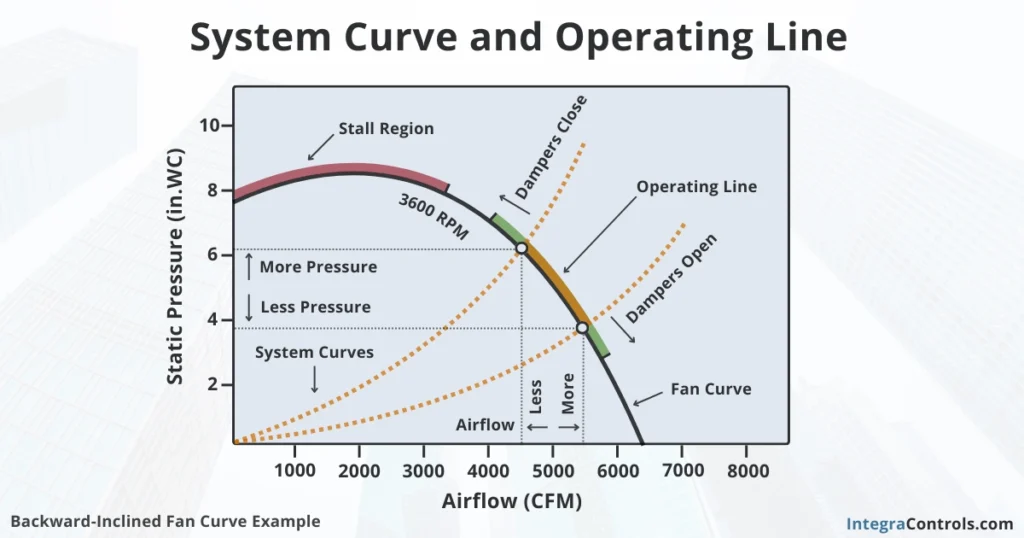
As mentioned before, changes in the system can cause variations in the airflow output of the overall system. Although this behavior can be negative, there are instances where it is desired. For instance, variations in the system curve are used by air damper terminal units to vary airflow output and control room temperature in some HVAC applications. As the terminal unit dampers close, the pressure in the system increases, moving the system curve to the left, which leads to decreased airflow, and vice versa. This is assuming there are no pressure compensation mechanisms, such as a bypass air damper.
This system curve movement establishes an “operating line” instead of a fixed operating point, as the system will move left and right across the fan curve depending on the pressure variation caused by system characteristic fluctuations.
Variable Speed Fan Curves
As laid out before, changes in the system can be beneficial for some applications where variations of the operating point are desired. This is also the case for many applications that use variable speed fans, made possible by the rapid development of variable frequency drive (VFD) technology and inverter-duty motors.
In a variable speed application, the fan can rotate at multiple speeds or RPM values. In such cases, we need to understand how the variation in RPM will affect the fan performance by analyzing a multi-RPM fan curve.
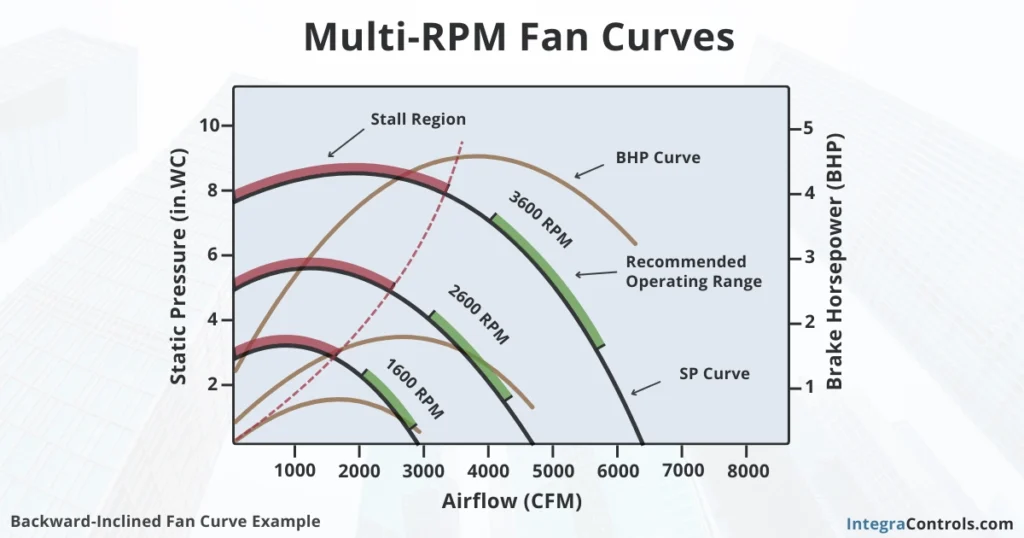
Multi-RPM fan curves show the fan performance at different RPM values. The same factors of a single RPM fan curve are shown, such as static pressure (SP), brake horsepower (BHP), and airflow (CFM). However, multiple fan curves are displayed, representing the performance for different RPM values. These values are derived from the so-called fan laws or affinity laws.
Fan Laws
In simple terms, the fan laws express the impact on airflow, static pressure, and brake horsepower when changing the RPM or speed of a specific fan.
- Fan Law 1: Airflow (CFM) is directly proportional to RPM. For instance, a 10% decrease in RPM will lead to a 10% reduction in airflow.
- Fan Law 2: Static Pressure (SP) changes with the square of RPM. In other words, a 10% decrease in RPM will lead to a 19% drop in static pressure.
- Fan Law 3: Brake Horsepower (BHP) changes with the cube of RPM. This means a 10% decrease in RPM will lead to a 27% cut in horsepower.
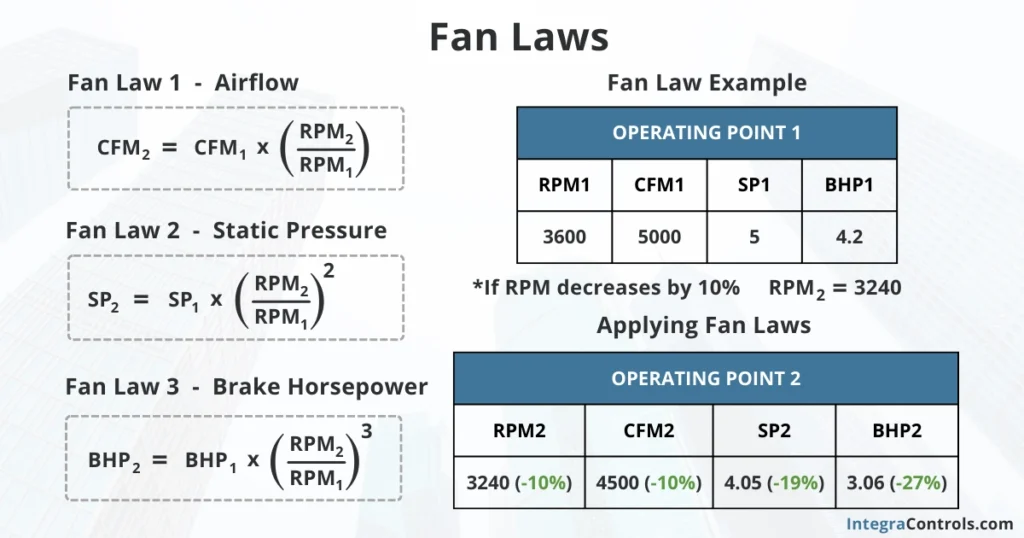
The multiple fan curves for the different RPM values provide information on the changes in airflow, static pressure, and brake horsepower characteristics, aiding in the selection of the mechanical equipment for different applications.
Variable Speed Fan and Fixed System
In a variable speed fan and fixed system application, the fan is typically mechanically connected to an inverter-duty motor powered by a variable frequency drive (VFD). The air distribution system remains unchanged; in other words, the system curve remains fixed.
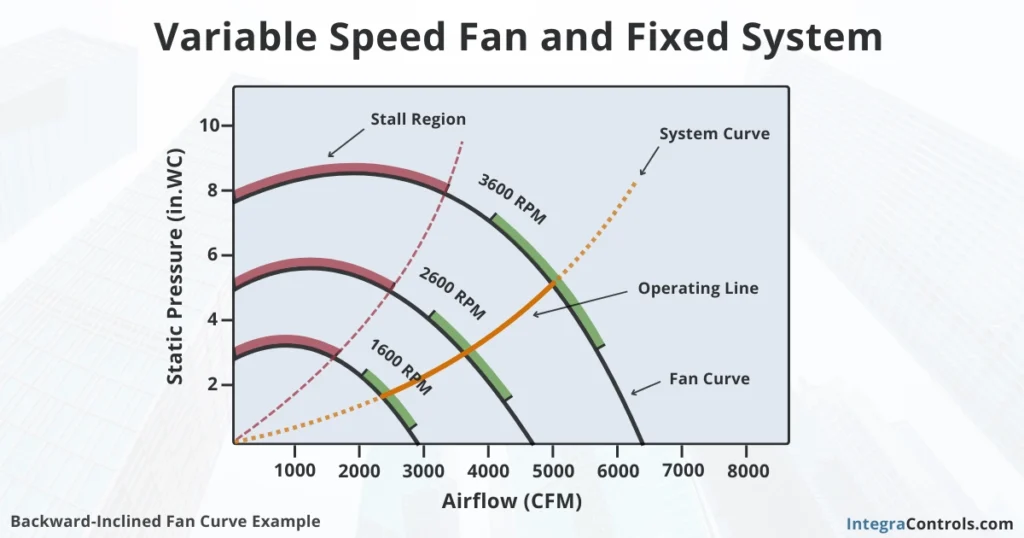
On the other hand, the fan curve changes for every RPM value, creating an “operating line” that moves along the system curve. This behavior shows the airflow and static pressure variations as the fan speed changes.
Similarly, we can observe the multiple brake horsepower curves and how they change with fan speed variations. Decreases in fan RPM can lead to significant savings in power consumption. A single-zone variable air volume system is a typical space comfort HVAC application that follows this principle.
Variable Speed Fan and Variable System
In a variable speed fan and variable system application, both the fan and system curves change as part of the overall system operation. The fan is mechanically connected to an inverter-duty motor powered by a VFD, and the air distribution system is typically composed of modulating dampers or terminal units.
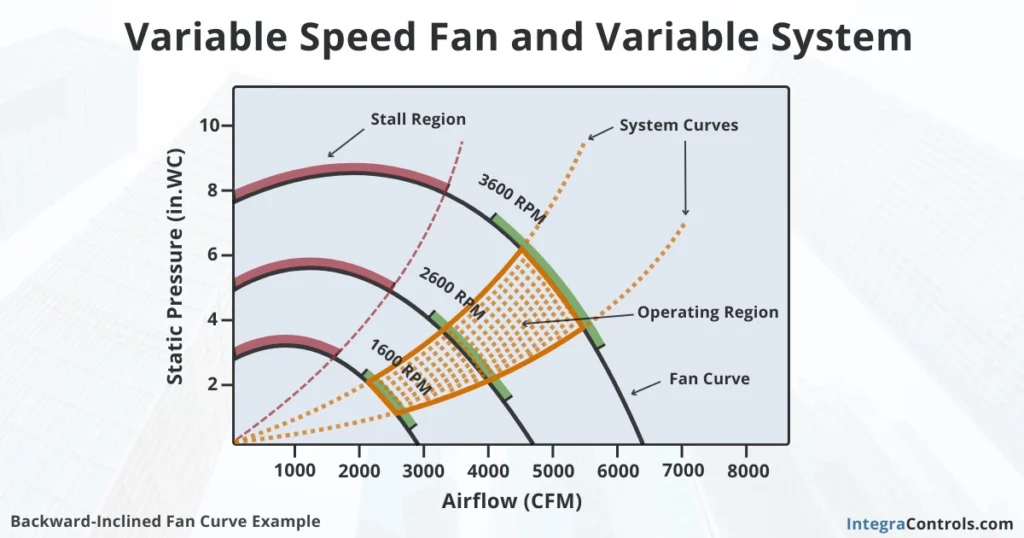
Shifts in the fan and system curves establish an “operating region,” meaning that at any given moment, the operating point will be inside that region depending on the system variations and the fan RPM.
Brake horsepower characteristic variations exhibit a similar behavior, with a BHP region also established depending on the location of the operating point at a given time. This means that under normal operation, the maximum and minimum power demand values are known, which can be very helpful for energy management and performance analysis purposes.
Static Pressure Control
What we just outlined is the exact operational principle of a multi-zone variable air volume system, which is one of the most energy-efficient applications used in the HVAC industry for multi-room comfort. However, if you are familiar with this application, you may know that the system is set up to control static pressure, and we have noticed that more often than not, this has led to poor performance due to incorrect implementation.
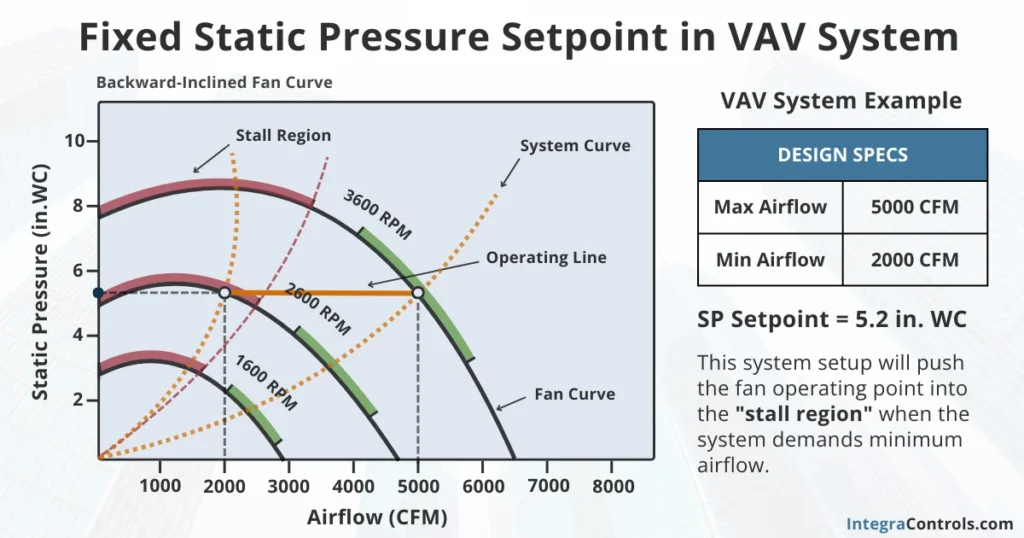
When static pressure is fixed in a variable speed fan and variable system application, the efficiency of the system is very poor, robbing from the real savings that the system can produce. In fact, the horizontal movement of the operating point over the static pressure setpoint can lead to fan surges as the point gets closer to the “stall region” with the system curve contractions and reduction in fan RPM, which can be detrimental to the system’s performance, efficiency, and equipment lifespan.
Another myth in static pressure control is the belief that a 1.5 in. WC static pressure setpoint is some magic number, when in reality, that fixed setpoint is causing more harm than good in most cases. We have written a comprehensive guide on static pressure control in multi-zone variable air volume systems where we outline the basics of static pressure setpoint establishment and control operation to maximize system performance and efficiency.
Fan Efficiency Curve
Fan efficiency is a measure of how effectively the fan transforms the mechanical energy exerted by the motor or rotating machine into kinetic energy (airflow) and potential energy (static pressure) as the output of the system.
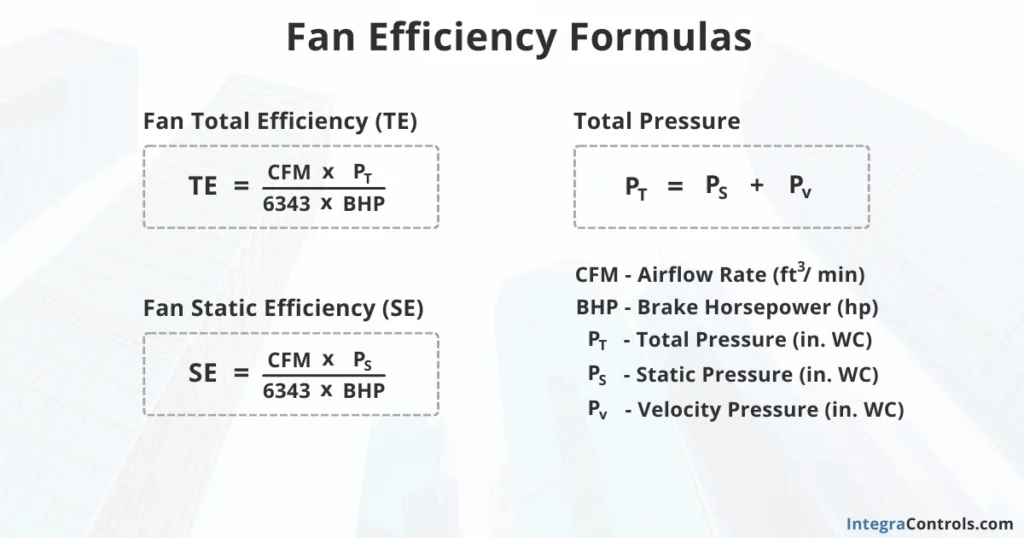
Fan total efficiency is calculated as the ratio between the fan airpower output (airflow times total pressure) and the fan input power (horsepower). On the other hand, fan static efficiency, another way of estimating the efficiency of the fan, uses static pressure instead of total pressure in the calculation.
Fan efficiency curves result from calculating the fan efficiency for all points of the fan curve. The fan static efficiency curve typically exhibits a bell shape as it moves from zero to maximum airflow. This occurs because at zero airflow, the “cut-off” point, there is no airpower as the airflow factor is zero. Conversely, at maximum airflow or the “free delivery” point, the static pressure is zero, rendering the airpower factor zero as well.
However, although the fan total efficiency curve follows a similar pattern to the fan static efficiency curve, they diverge at higher levels of airflow. This occurs because total pressure is composed of static pressure and dynamic pressure, or velocity pressure. As the static pressure drops, the dynamic pressure increases until total pressure equals dynamic pressure at zero static pressure and maximum airflow. Peak efficiency occurs when the factor between airflow and pressure is maximum compared to the horsepower.
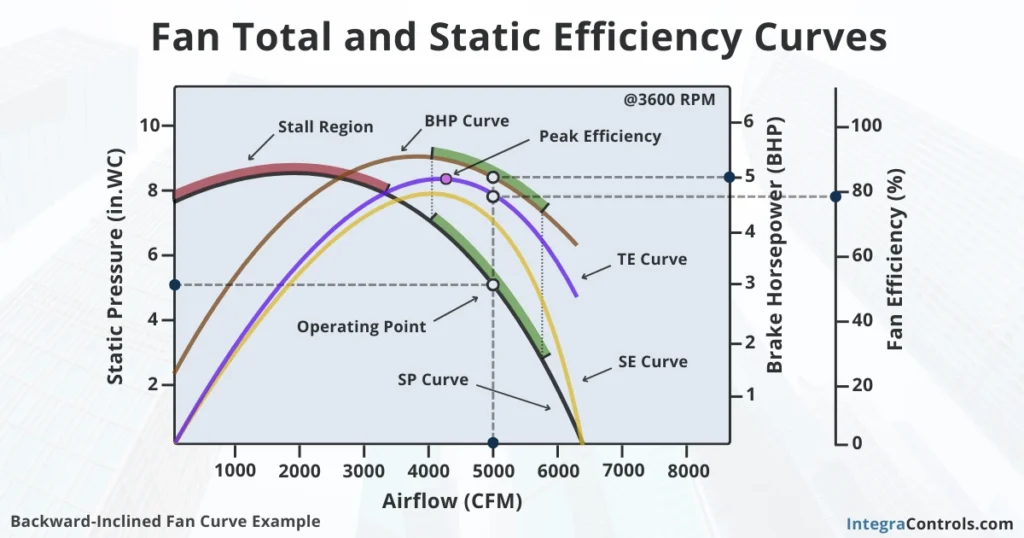
Choosing more efficient fans can reduce equipment power consumption for various applications. Fan efficiency curves assist engineers and consultants in the fan selection process. The fan operating range is not only limited by the fan curve’s “stall region” but also by the efficiency curve characteristics. AMCA Standard 205 recommends no more than a 15-percentage-point deviation below the fan’s total peak efficiency as an acceptable range for selecting an efficient fan.
Fan Energy Index
Despite the usefulness of fan efficiency curves in the fan selection process, there arose a need for a more comprehensive and accurate measure of a fan’s energy performance across various operating conditions. Consequently, a new fan efficiency metric referred to as the fan energy index (FEI) was developed by AMCA.
The FEI is calculated based on the fan’s efficiency at a specific operating point relative to a baseline fan, as per AMCA Standard 208. When calculating the FEI of a specific fan, its performance in terms of energy efficiency is compared to that of the baseline fan operating under the same conditions. The FEI is a ratio that indicates how much more or less efficient the fan is compared to the baseline fan. An FEI greater than 1 indicates that the fan is more efficient than the baseline fan, while an FEI less than 1 indicates lower efficiency. An FEI value greater than 1 is typically the minimum requirement for selection.
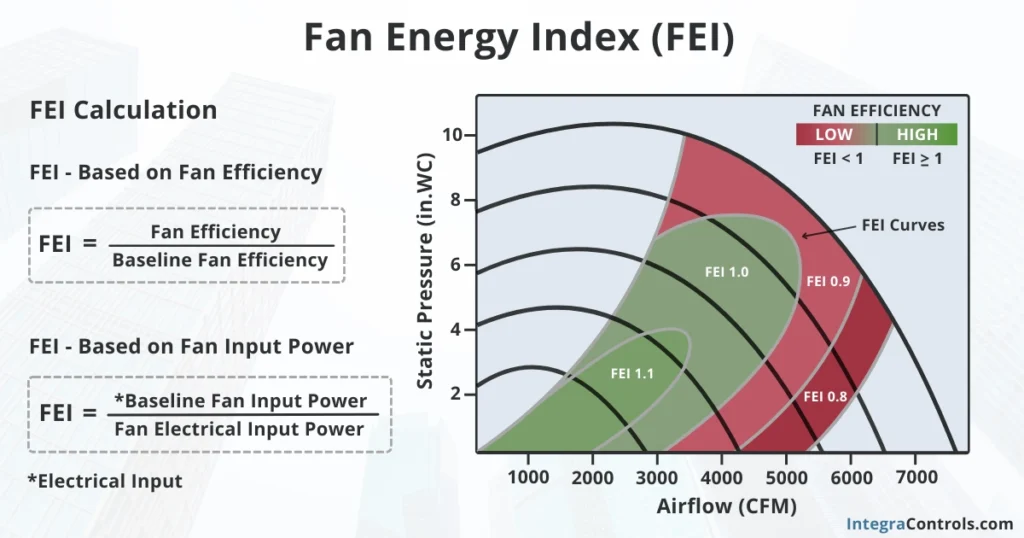
The fan energy index considers the fan’s electrical input power, airflow rate, and pressure. The higher the FEI value, the more efficient the fan is. This index helps identify fans that are more energy-efficient, aiding in the selection of equipment that reduces energy consumption and operational costs over time.
FEI is used by engineers, facility managers, and energy consultants to select fans that meet energy efficiency targets in various applications, such as HVAC systems, manufacturing processes, and ventilation systems. FEI values are typically represented as contour areas inside the fan curves, aiding in the visualization of the fan’s operating regions of better energy-efficiency performance, making it very useful when selecting a fan for different applications.
In Summary
Fan curves and fan efficiency are crucial metrics in selecting appropriate fans, sizing motors, and optimizing energy consumption. Fan curves help to predict how a fan will perform under various conditions, while fan efficiency metrics aid in assessing the fan performance from an energy consumption standpoint.

